Stop Guessing, Start Diagnosing: How to Find Your Tegra's Real Performance Bottleneck
Here's a scenario that plays out in our community forums at least a dozen times a week: someone's Tegra device is struggling in a game or app, they read that undervolting helps, they spend an afternoon tweaking settings, and... nothing changes. Or they bump up their fan profile, and still the frame rate stays stuck in the mud. The problem wasn't heat. It wasn't the GPU clocks. It was something else entirely, and they never actually checked.
Bottleneck diagnosis sounds technical and intimidating, but it's really just a process of elimination. And once you know where to look, it gets pretty straightforward. Let's break it down.
Why Tegra Bottlenecks Are Trickier Than Desktop PCs
On a traditional desktop, you've got clearly separated components — your CPU sits on the motherboard, your GPU is a discrete card, and your RAM runs independently. Bottleneck calculators designed for those systems look at the gap between those components and flag the weakest link.
Tegra is different. Everything is integrated on a single System-on-Chip (SoC). The CPU cores, GPU cores, memory controller, and even the video decode engine all share the same die and, critically, the same memory pool. That tight integration means bottlenecks can be sneaky. A problem that looks like a GPU issue might actually be the memory bus getting saturated. Something that feels like a CPU bottleneck might be a scheduling problem with how Android is assigning work to Tegra's big.LITTLE core clusters.
So before you start throwing optimizations at your device, you need to actually observe what's happening under the hood.
Step One: Get the Right Monitoring Tools
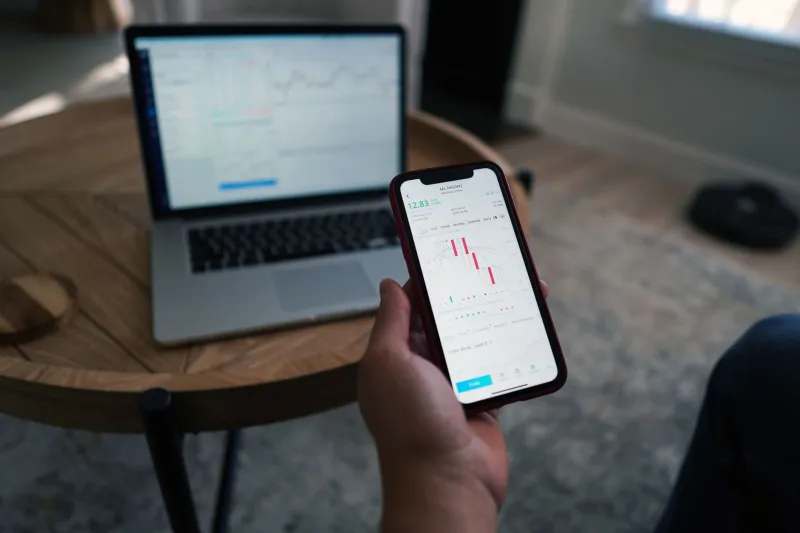
You can't diagnose what you can't see. The first thing you need is a solid overlay or logging tool running while you reproduce the problem.
For Android-based Tegra devices, NVIDIA's own developer tools are worth installing if you can access them, but for most users, apps like Perfetto, CPU-Z for Android, or the built-in developer options with GPU rendering stats enabled give you enough to work with. For Shield TV users specifically, the system info overlay accessible through developer mode is genuinely useful.
For the Nintendo Switch (yes, it runs Tegra X1), homebrew tools like SysDVR paired with performance logging overlays can surface useful metrics if you're running custom firmware — though that's a whole separate conversation.
What you're looking for, at minimum:
- CPU utilization per core (not just overall average)
- GPU utilization percentage
- Memory clock speed and, if available, memory bandwidth usage
- Thermal readings
- Frame time (not just FPS — frame time tells you a lot more)
Step Two: Run Your Baseline
Launch the game or app that's giving you trouble and let it run for at least five minutes in the most demanding scenario you can reproduce — a crowded multiplayer lobby, a graphically intense area, whatever tanks your performance consistently.
Record or note your metrics. You're looking for patterns, not just peak numbers. Specifically:
- Is your GPU utilization consistently near 100%? That's GPU-bound.
- Are your CPU cores maxed out while the GPU sits at 60-70%? That's CPU-bound.
- Are both sitting at moderate utilization while frame times are still ugly? That's often a memory or scheduling issue.
That third scenario trips people up the most, because it doesn't look like a traditional bottleneck on the surface.
Comparing Across Generations: Maxwell, Pascal, and Ampere
Where your Tegra falls in NVIDIA's generational lineup actually changes where your bottleneck is most likely to live.
Maxwell-era Tegra devices (like older Shield tablets) have the tightest memory bandwidth constraints of the bunch. If you're running anything that pushes high-resolution textures or complex particle effects, there's a solid chance your bottleneck is memory bandwidth before it's anything else. The GPU cores themselves aren't the problem — they're just waiting on data that can't arrive fast enough.
Pascal Tegra (Shield TV 2017, Switch original) added meaningful bandwidth improvements, but the CPU side — four Cortex-A57 cores — starts to show its age in anything that leans on game logic, AI, or physics calculations. Modern games built assuming at least six CPU threads will often stall here. You'll see GPU utilization drop while CPU cores are pegged.
Ampere-based devices (Shield TV Pro 2019 and later) shift the calculus again. The CPU is no longer the obvious weak point for most workloads, and memory bandwidth is genuinely competitive. For these devices, the bottleneck in demanding scenarios often comes down to thermal management — the chip can sustain high clocks, but only as long as temperatures stay in range. Frame time spikes that correlate with temperature climbs are the telltale sign.
The Diagnostic Flowchart (Walk Through This Before Doing Anything Else)
Here's the quick-reference process we'd recommend running through before changing any settings:
-
Is GPU utilization above 95% and frame times are high? → You're GPU-bound. Look at resolution scaling, texture quality settings, and whether your game has a performance mode.
-
Is CPU utilization high on multiple cores while GPU is below 80%? → You're CPU-bound. Check whether background apps are stealing resources, and look for game-specific CPU optimization settings.
-
Are both CPU and GPU at moderate utilization but performance is still bad? → Suspect memory bandwidth or scheduling. Try reducing texture resolution specifically (not overall resolution) and watch whether performance improves disproportionately.
-
Does performance degrade over time in a consistent pattern? → Thermal throttling. Correlate your frame time spikes with temperature readings.
-
Is the problem only in specific scenes or moments, not consistently? → Could be asset streaming or storage I/O. Watch for storage activity spikes in your monitoring overlay.
Real-World Example: Fortnite on Shield TV
Let's make this concrete. Fortnite on Shield TV is a common pain point in our forums. Users report inconsistent frame rates, particularly in build-heavy scenarios.
When you run monitoring during a match, here's what you typically see: GPU utilization is high but not maxed out, CPU utilization is elevated on two to three cores, and frame time variance is significant — meaning frames aren't just slow, they're inconsistent. That inconsistency points toward a CPU scheduling problem more than a raw performance ceiling. The GPU could do more, but it's waiting on the CPU to feed it work.
The practical fix here isn't to reduce resolution (which would help a GPU bottleneck). It's to reduce scene complexity — lower build geometry settings, reduce particle effects, and make sure no background processes are competing for CPU cycles. That's a completely different solution than what most people try first.
Don't Skip This Step Before Optimizing
The whole point of this process is to stop wasting time. Optimizations that target the wrong bottleneck don't just fail to help — they sometimes make things worse. Reducing resolution when you're CPU-bound, for example, just gives your GPU more headroom it wasn't using anyway, while your actual problem continues unchanged.
Five to ten minutes of monitoring before you start tweaking will save you hours of frustration. Your Tegra device is capable of more than most people get out of it — but only if you're solving the right problem.