Stop Blaming the CPU: What's Really Slowing Down Your Tegra Device
Here's a scenario that plays out constantly in Tegra communities across the internet: someone notices their device stuttering during a game or dropping frames in a video app, they pull up a system monitor, see the CPU sitting at 80-something percent, and immediately conclude their chip just isn't fast enough. Maybe they start hunting for a newer device, or they spend hours tweaking governor settings trying to squeeze out more clock speed.
The problem? They're diagnosing the wrong organ entirely.
CPU utilization numbers are one of the most misread metrics in mobile performance troubleshooting. High CPU usage doesn't automatically mean your processor is the bottleneck — it often means something else is backed up and the CPU is sitting there, spinning its wheels, waiting on data that hasn't arrived yet. If you want to actually fix your Tegra's performance problems, you need to understand what's happening deeper in the pipeline.
Memory Bandwidth: The Highway That's Always Jammed
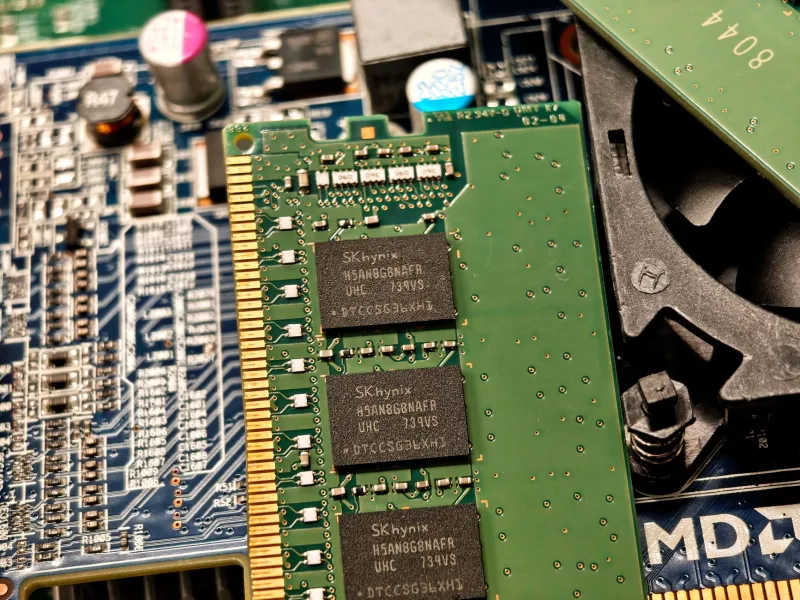
Tegra's unified memory architecture is one of its defining characteristics — the CPU and GPU share the same physical memory pool. On paper, this is efficient. In practice, it creates a brutal competition for bandwidth, especially under demanding workloads.
When your GPU is rendering a complex scene while your CPU is simultaneously processing game logic, audio, and background tasks, they're all fighting for lanes on the same memory highway. The CPU might be executing instructions just fine, but if it has to wait on memory reads that the GPU's requests keep pushing back, your performance tanks — and your CPU usage counter still climbs because the cores are technically active, just stalled.
This is especially pronounced on older Tegra variants like the X1 found in the original Nintendo Switch and NVIDIA Shield TV. The memory bus in those chips simply wasn't designed with today's texture sizes and data-heavy workloads in mind. Throwing more CPU clock speed at that problem does essentially nothing.
What to watch instead: Use a tool like Tegra Stats (on Shield devices) or a GPU-focused monitoring overlay to check memory bandwidth utilization alongside CPU load. If your bandwidth is maxed out while your CPU cores still have headroom, you've found your real bottleneck.
Driver Inefficiency: The Silent Performance Tax
This one doesn't get nearly enough attention in casual performance discussions. NVIDIA's Tegra drivers — particularly the graphics drivers — sit between your apps and the hardware, and how well they translate software requests into hardware instructions matters enormously.
Driver overhead is a real cost. Every draw call, every texture bind, every shader compilation event that passes through a poorly optimized driver path burns CPU cycles that could've gone toward actual work. On desktop GPUs, this overhead is relatively small compared to the raw horsepower available. On a mobile Tegra chip, that same overhead represents a much larger fraction of your total budget.
The frustrating part is that driver issues often look exactly like CPU bottlenecks in monitoring tools. The CPU is busy, sure — but it's busy doing driver housekeeping rather than the work you actually care about. Updating to the latest firmware on your Shield or ensuring your Android version matches NVIDIA's recommended baseline for your device can reduce this overhead meaningfully. It's not glamorous advice, but it works.
Workload Scheduling: When the OS Gets in Its Own Way
Tegra chips use heterogeneous core configurations — a mix of performance-focused and efficiency-focused cores working in tandem. The idea is smart: light tasks go to the small, power-efficient cores, and heavy lifting goes to the big performance cores. The scheduler in the operating system is supposed to make these assignments intelligently.
Except it often doesn't.
Game engines and streaming apps frequently generate workloads with irregular timing characteristics — big bursts of computation followed by relative quiet. If the scheduler misreads these patterns and parks a demanding task on an efficiency core because it looked idle a millisecond ago, you get a latency spike that shows up as a stutter or frame drop. The CPU wasn't overloaded. It was just given work on the wrong core at the wrong time.
This is one reason why performance governor settings actually matter on Tegra devices, but not in the way most guides explain. You're not trying to force maximum clock speeds — you're trying to reduce the scheduler's hesitation about committing to the big cores when a demanding task shows up. Governors like schedutil handle this better than older options on modern Tegra-based Android builds, and if your device supports custom governor tuning, the hispeed_freq and up_rate_limit_us parameters are worth understanding.
How to Actually Diagnose Your Bottleneck
Rather than guessing, here's a practical approach for Tegra owners who want real answers:
Step 1: Separate CPU and GPU load. Use an overlay that shows both simultaneously. If GPU utilization is maxed while CPU has breathing room, your graphics pipeline is the constraint — not your processor.
Step 2: Check memory bandwidth saturation. On Shield devices, NVIDIA's developer tools expose this. On other Tegra-based hardware, third-party apps like GPU-Z (where available) or developer mode diagnostics can surface this data.
Step 3: Watch for thermal correlation. If performance degrades after several minutes of use, cross-reference your CPU load data with temperature readings. Thermal throttling can masquerade as a processing bottleneck — the chip slows down to protect itself, load climbs because tasks take longer to complete, and the CPU looks like it's struggling when it's actually just running cool.
Step 4: Test with a single-threaded benchmark. If your device performs well in isolated single-threaded tests but falls apart under mixed workloads, that's a strong signal that memory contention or scheduling is the issue rather than raw compute performance.
The Fix Is Usually Not a New Device
Perhaps the most practical takeaway here is that the real Tegra performance bottlenecks — memory bandwidth, driver overhead, scheduling inefficiency — are often addressable without spending a dime. Keeping firmware current, understanding which governor settings suit your use case, and managing background processes to reduce memory contention can recover a surprising amount of performance from hardware you already own.
The CPU in your Tegra device is probably doing its job just fine. Before you write it off, spend twenty minutes actually looking at what's going on underneath the surface. You might be surprised how much headroom is sitting there, waiting to be unlocked.